A common open source approach to observability will begin with databases and visualizations for telemetry - Grafana, Prometheus, Jaeger. But observability doesn’t begin and end here: these tools require configuration, dashboard customization, and may not actually pinpoint the data you need to mitigate system risks.
Coroot was designed to solve the problem of manual, time-consuming observability analysis: it handles the full observability journey — from collecting telemetry to turning it into actionable insights. We also strongly believe that simple observability should be an innovation everyone can benefit from: which is why our software is open source.
Features:
- Cost monitoring to track and minimise your cloud expenses (AWS, GCP, Azure.)
- SLO tracking with alerts to detect anomalies and compare them to your system’s baseline behaviour.
- 1-click application profiling: see the exact line of code that caused an anomaly.
- Mapped timeframes (stop digging through Grafana to find when the incident occurred.)
- eBPF automatically gathers logs, metrics, traces, and profiles for you.
- Service map to grasp a complete at-a-glance picture of your system.
- Automatic discovery and monitoring of every application deployment in your kubernetes cluster.
We welcome any feedback and hope the tool can improve your workflow!
Comments URL: https://news.ycombinator.com/item?id=43623820
Points: 15
# Comments: 0
Connectez-vous pour ajouter un commentaire
Autres messages de ce groupe


(* within a few minutes of SEC filing)
Currently does it for 1000+ US companies and specifically earnings related filings. By US companies, I mean the ones that are obliged to file SEC filings.
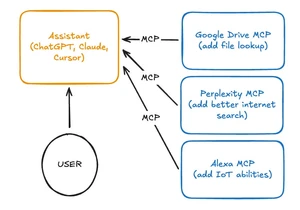
Article URL: https://blog.sshh.io/p/everything-wrong-with-mcp
Article URL: https://arxiv.org/abs/2503.24322
Comments URL: https://news.ycombinator.c


Article URL: https://loganius.org/2025/04/i-bought-a-mac/
Comments URL: ht