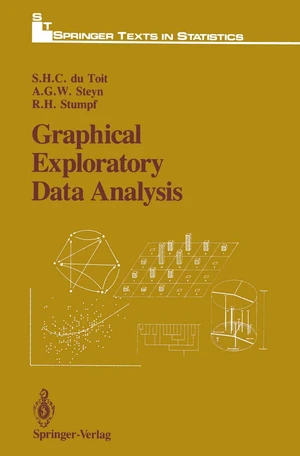
Portraying data graphically certainly contributes toward a clearer and more penetrative understanding of data and also makes sophisticated statistical data analyses more marketable. This realization has emerged from many years of experience in teaching students, in research, and especially from engaging in statistical consulting work in a variety of subject fields. Consequently, we were somewhat surprised to discover that a comprehen sive, yet simple presentation of graphical exploratory techniques for the data analyst was not available. Generally books on the subject were either too incomplete, stopping at a histogram or pie chart, or were too technical and specialized and not linked to readily available computer programs. Many of these graphical techniques have furthermore only recently appeared in statis tical journals and are thus not easily accessible to the statistically unsophis ticated data analyst. This book, therefore, attempts to give a sound overview of most of the well-known and widely used methods of analyzing and portraying data graph ically. Throughout the book the emphasis is on exploratory techniques. Real izing the futility of presenting these methods without the necessary computer programs to actually perform them, we endeavored to provide working com puter programs in almost every case. Graphic representations are illustrated throughout by making use of real-life data. Two such data sets are frequently used throughout the text. In realizing the aims set out above we avoided intricate theoretical derivations and explanations but we nevertheless are convinced that this book will be of inestimable value even to a trained statistician.
Price history
▲5.83%
Jan 27, 2022
€87.59
▼-0.05%
Jan 26, 2022
€82.76
▼-0.55%
Jan 24, 2022
€82.80
▼-0.08%
Jan 18, 2022
€83.26
▲0.54%
Jan 17, 2022
€83.33
▼-0.06%
Jan 11, 2022
€82.88
▼-0.04%
Jan 10, 2022
€82.93
▲0.44%
Jan 4, 2022
€82.96
▲0.59%
Dec 28, 2021
€82.60
▼-0.53%
Dec 21, 2021
€82.11

