If you’re experiencing a sluggish internet connection, it’s probably time to check the speed. We’ll show you several ways to measure the speed of your internet connection using on-board tools in Windows, Linux, and macOS. This is useful, for example, if you want to check the guaranteed speed of your provider. But it also helps to check the current speed of your connection in the event of problems and performance drops with web services, streaming, and other functions.
Further reading: Should I disconnect my PC from the internet when I have a virus?
Use Google search to measure the speed
If you enter the term speedtest in Google search, you can check your current Internet speed with one click using the Perform Speed Test button. The tool first checks the download speed and then the upload speed from your network to the internet. Click on Test Again to start the test a second time.

Thomas Joos
Thomas Joos
            <div class="scrim" style="background-color: #fff" aria-hidden="true"></div>
    </div></figure><p class="imageCredit">Thomas Joos</p></div>
You can use the Info link to display further data on the speed test, for example how the measurement results are analyzed.
Ookla speed test with results history and Windows app
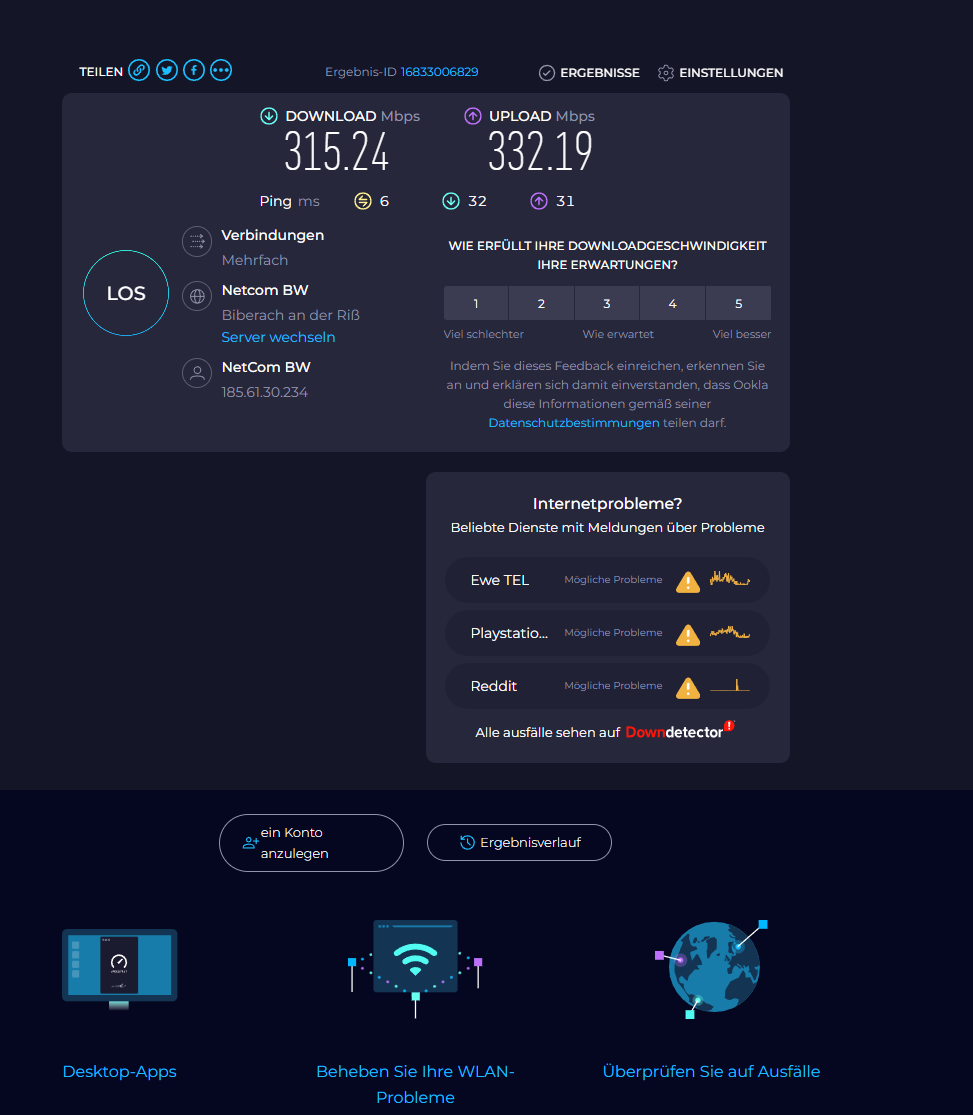
One of the best-known speed tests is the speed test from Ookla. This test allows you to test the speed of your internet connection without registering. To test the speed, open the link and click on Go. You will also see the name of your internet provider and your external IP address underneath the gauge. If you want to measure your internet speed regularly, you can register an account with Ookla, but this is optional.

Thomas Joos
<div class="lightbox-image-container foundry-lightbox"><div class="extendedBlock-wrapper block-coreImage undefined"><figure class="wp-block-image size-full enlarged-image"><img data-wp-bind--src="selectors.core.image.enlargedImgSrc" data-wp-style--object-fit="selectors.core.image.lightboxObjectFit" alt="Messen der Internetgeschwindigkeit mit Ookla" class="wp-image-2476781" width="973" height="1115" loading="lazy" /></figure><p class="imageCredit">Thomas Joos</p></div> </div></figure><p class="imageCredit">Thomas Joos</p></div>If you log in with an account, you can view the last measurements using the Results History button. If you want to test the speed of your internet connection regularly, you can install the Speedtest by Ookla app from the Microsoft App Store and use it to measure your speed locally at any time.
Measure the internet speed with on-board tools in Windows, Linux, and macOS
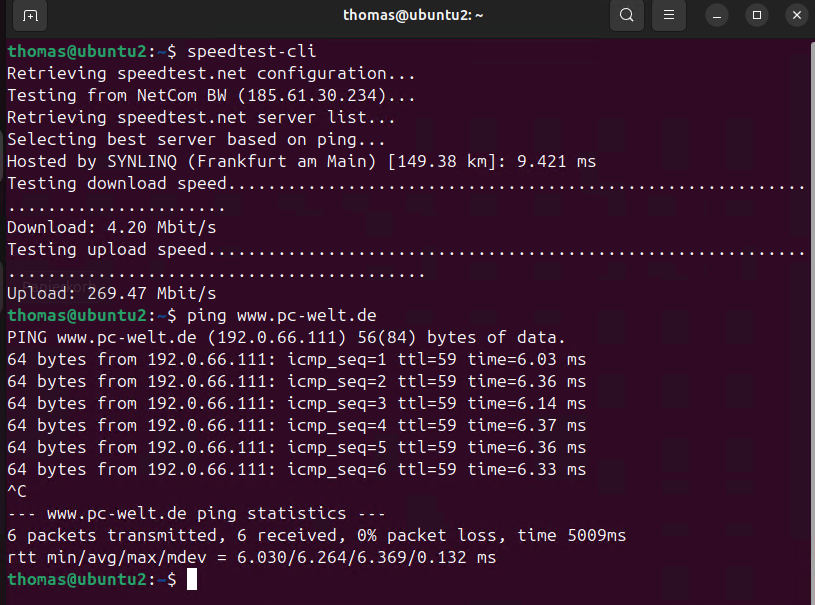
On-board tools such as the ping command line tool can be used to measure internet speed and network latency in Windows, Linux, and macOS. You can use this tool to measure the time it takes for a data packet to travel from your own machine to a remote host and back. To do this, ping sends ICMP echo request packets to the destination address and measures the time until the response (ICMP echo reply). This latency time is specified in milliseconds (ms). Enter the following in the command line:
ping
You can enter any address, such as a domain (pc-welt.de) or an IP address, for example 8.8.8.8 (Google). Well-known addresses like Google.com, Cloudflare.com, or public DNS servers such as 8.8.8.8 (Google DNS) and 1.1.1.1 (Cloudflare DNS) are well suited for tests, as these are generally available and stable worldwide. An example of the output of a ping command looks like this:
Response from 142.250.74.206: Bytes=32 Time=12ms TTL=54
Response from 142.250.74.206: Bytes=32 Time=13ms TTL=54
Response from 142.250.74.206: Bytes=32 Time=12ms TTL=54
Response from 142.250.74.206: Bytes=32 Time=12ms TTL=54
This output contains several important pieces of information:
- Response from: This indicates that the destination is reachable and the corresponding IP address has been reported back. The internet connection is therefore working. If you specify a domain, for example pc-welt.de, then you also know that the name resolution is working.
- Bytes=32: The size of the data packets sent and received is displayed here, in this case 32 bytes. This is sufficient for measuring the Internet speed.
- Time=12ms: This number indicates the latency time in milliseconds, i.e. how long it took the packet to get there and back. A short time indicates a stable and fast connection while a longer time indicates delays. The latency time can serve as an indicator of the network speed. A very high latency (over 100ms) can indicate a slow or unstable connection. If ping does not receive a response or packet loss is displayed, there may be a problem with the network infrastructure, such as a misconfiguration of the router or a fault with the internet provider. Regular fluctuations in the response times can also indicate network load or faults.
- TTL=54: The time-to-live (TTL) field shows how many routers the packet has passed through. A low value can indicate that the packet had to pass through many stations, which can lead to delays.
Using the results for troubleshooting
If no response is returned to a ping command, the message Request Timed Out is usually displayed. This may indicate an unreachable network, a firewall blocking ICMP packets, or a network problem. For a more in-depth analysis, you can use additional tools such as tracert (Windows) or traceroute (Linux) to analyze the exact path of the packets and determine where the delays or packet losses occur. Under Windows, the command is as follows:
tracert google.com
This shows the hops (network nodes or routers) between the local system and Google.com. The output looks like this, for example:
Route tracing to google.com [142.250.74.206] over a maximum of 30 sections:
1 1 ms 1 ms 1 ms 192.168.1.1
2 15 ms 12 ms 13 ms 10.23.56.1
3 25 ms 26 ms 24 ms 108.170.250.161
4 40 ms 39 ms 38 ms 142.250.74.206
Tracing completed.
In this output, the first column shows the hop number, the second column shows the latency times (ms) and the third column shows the IP address or host name of the node. The command works similarly on Linux systems:
traceroute google.com
The output is similar to tracert under Windows and shows all intermediate steps up to the destination, which helps to localize delays along the network.
Further options for measuring internet speed via the Linux command line
In addition to checking the latency and route, there are also commands and tools that can test the bandwidth and throughput.

Autentifică-te pentru a adăuga comentarii
Alte posturi din acest grup

The ergonomics of your desk and chair greatly influence how good you

Amazon Prime Day 2025 is nearly here, and if you’ve been eyeing those

Amazon’s annual Prime Day event of the year is coming soon, kicking o

Amazon’s Prime Day sales offer one of the year’s best opportunities t


Stop the presses! Samsung’s T9 portable SSD just dropped to the best

The mouse is configured by default in Windows for use by right-handed
