Elastic Enterprise Search 7.14 now lets you manage all your Elastic products from a single management interface, so you can navigate to App Search and Workplace Search from Kibana without losing your way. We’re also delivering more flexibility and configurability with precision tuning in App Search and content source flexibility and synonym support in Workplace Search. With all these enhancements, you can set up your teams and customers to find what they’re looking for faster than ever:
Genera
Elastic Observability 7.14 introduces the general availability of unified telemetry and centralized agent management with Elastic Agent and Fleet, enabling faster and simpler data onboarding, and reduced security risk, in addition to enhanced correlations for accelerated root cause analysis in Elastic APM. These new features allow customers to:
Collect all forms of data from anywhere with a single unified agent per host, with just one agent to install, configure, and scale
Deploy endpoi
Elastic Security 7.14 introduces the industry’s first free and open Limitless XDR solution, unifying the capabilities of SIEM and endpoint security. It is made possible by the general availability of Elastic Agent, which helps equip it to prevent, detect, and respond to threats before adversaries can steal sensitive information or sabotage operations. Let’s dig into the best of what it brings. Quickly quarantine and inspect endpoints Elastic Security 7.14 accelerates response by enabling analyst

We are pleased to announce the general availability (GA) of Elastic 7.14, including our Elastic Enterprise Search, Observability, and Security solutions, which are built into the Elastic Stack — Elasticsearch and Kibana. Elastic 7.14 empowers organizations with the first free and open Limitless XDR, which delivers unified SIEM and endpoint security capabilities in one platform. The latest release makes it even easier to manage and monitor data from a growing volume of diverse sources

As we’ve shown in a previous blog, search-based detection rules and Elastic’s machine learning-based anomaly detection can be a powerful way to identify rare and unusual activity in cloud API logs. Now, as of Elastic Security 7.13, we’ve introduced a new set of unsupervised machine learning jobs for network data, and accompanying alert rules, several of which look for geographic anomalies. In this blog post, we’ll explore a case study demonstrating how network data can yield important detections

Hiya! Our Elasticsearch team is continually improving our index Lifecycle Management (ILM) feature. When I first joined Elastic Support, I quickly got up to speed via our Automate rollover with ILM tutorial. I noticed after helping multiple users set up ILM that escalations mainly emerge from a handful of configuration issues. In the following sections, I’d like to cover frequent tickets, diagnostic flow, and common error recoveries. All commands shown can be run via Kibana’s Dev Tools. C

One of Rain Hu's favorite moments of the day is her early morning run. "I run six kilometers minimum daily, rain or shine," she says. "I enjoy the time alone because it allows me to have time for self-reflection and self-conversation." The discipline that it takes to maintain a healthy lifestyle is carried throughout her life. As a wife, mother of two young boys, and sales leader, Rain optimizes her time so that she can show up fully and authentically in all aspects of her life. We sat down with

In my previous blog post, I demonstrated how to use Prometheus and Fluentd with the Elastic Stack to monitor Kubernetes. That’s a good option if you’re already using those open source-based monitoring tools in your organization. But, if you’re new to Kubernetes monitoring, or want to take full advantage of Elastic Observability, there is an easier and more comprehensive way. In this blog, we will explore how to monitor Kubernetes the Elastic way: using Filebeat and Metricbeat. Using Filebeat and

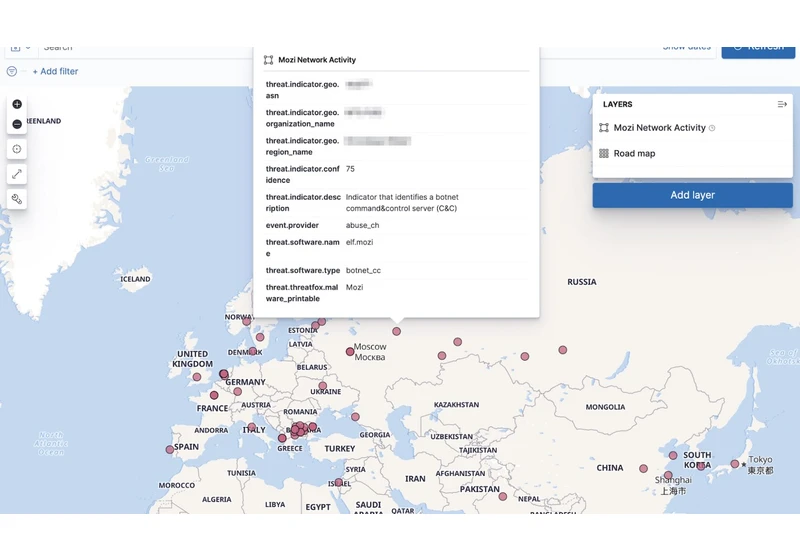
Detecting and preventing malicious activity such as botnet attacks is a critical area of focus for threat intel analysts, security operators, and threat hunters. Taking up the Mozi botnet as a case study, this blog post demonstrates how to use open source tools, analytical processes, and the Elastic Stack to perform analysis and enrichment of collected data irrespective of the campaign. This will allow you to take the lessons and processes outlined below to your organization and apply them to yo

Leon Gubbels is a Security Business Developer at ENGIE, an Elastic MSP. Remco Sprooten is the Product Owner for the security team. Together they describe how their team expanded their security-as-a-service offer to address operational technology (OT) as well as traditional IT systems. The 2010 Stuxnet malicious software attack on a uranium enrichment plant in Iran had all the twists and turns of a spy thriller. The plant was air gapped (not connected to the internet) so it couldn’t be targeted


